# Segmentation
## Recency
Segmenting Users/Customers by their Recency status produces three (3) status:
* New - customers having the first purchases/transactions in the viewing period;
* Return - customers purchasing before the period and continuing having purchases/transactions in the viewing period;
* Churn - customers purchasing before the period and not having purchases/transactions in the viewing period.
### Steps to run Recency Segmentation
Use **`/`** to run widget **Segment,** then choose the id column that you want to segment. It can be **User ID**, **Customer ID** or **Product ID**.
Choose to segment **by their Recency**
A pop-up will appear for you to setup for the Recency Segmentation:
* Filter - \[Optional] You can choose to run the Segmentation with certain conditions (example: in certain region(s) or product type(s))
* Date Dimension - choose the Date column
* Period - you can choose **All** or indicate a certain period with **Since**
A Chart will be produced by Presight AI to demonstrate the Recency status for your Customer:
A new metric - Number of CustomerID - will be created by accumulating all customer from the beginning of the chosen period and it will be broken-down to 3 status: New, Return and Churn.
In this example, Presight AI finds out that if customers has not made any purchases/transactions **within 28 days** (recommended interval from Presight AI), they are **91.81%** likely to have **churned**.
You can still change the interval or the confidence level by using the side bar:
* You can configure the Churn Interval:
* or configure the Confidence Level:
After segmenting by Customer Recency, you can use the segmentation dimension as any other dimensions in your workspace. It can be broken-down by related metrics:
{% hint style="info" %}
The temporary name of the clustering dimension is visible in the chart 
{% endhint %}
You can save the Cumulative Customer ID Count and its Recency status dimension by using the side bar:
Then, you can name, describe, save, then use them like any other metrics and dimensions.
## Clustering
In clustering, we use K-Means, which is a robust technique for grouping similar data points, such as customers with comparable purchasing behaviors, into clusters for pattern recognition and decision-making. To refine this process, we also apply Natural Language Processing (NLP) and Tree-Based Models for meticulous feature selection and cluster trait profiling. NLP extracts and structures key insights from textual data, while Tree-Based Models prioritize the most influential features. This dual approach ensures clusters are defined by their most distinctive attributes. The result is a set of well-defined clusters, each with a clear profile based on the most relevant characteristics.
This enables businesses to tailor strategies, optimize marketing campaigns, and enhance product development with precision, leading to improved customer engagement and business performance.
### Steps to run clustering
Use **`/`** to run widget **Segment,** then choose the id column that you want to segment. It can be **User ID**, **Customer ID** or **Product ID**.
Choose to segment **by their Value**
A pop-up will appear for you to indicate all criteria to cluster:
1. Choose dimension to cluster - it is default to be the dimension that you have chosen, but you still can change it here.
2. Choose 2 criteria to cluster - it can be the combination of sales and quantity, or any other combinations that make sense to your business.
3. Choose granularity - customer behaviors can be different in vary businesses, choose the correct granularity can produce application customer segmentation. For example, in a grocery supermarket, customer behaviors should be monitored daily or weekly; but in a healthcare clinic, quarterly or yearly monitoring might be more suitable.
4. Choose period - you can choose for how long you want to see the behaviors - 6 months, 1 year or 3 years.
A Chart will be produced by Presight AI to demonstrate recommended clusters for your Customer:
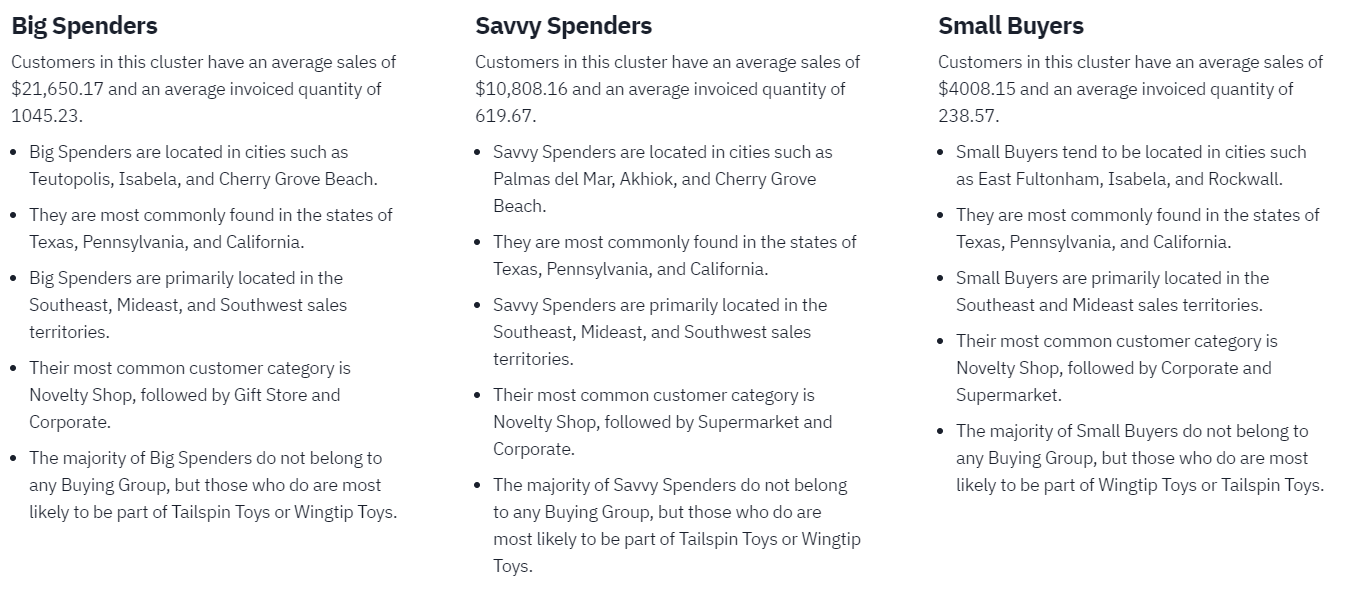
To understand more, you will need to right-click on each cluster and choose **Profit this cluster** to see the descriptions:
Each cluster has different average spendings and quantities, might locate at different regions and buy vary products.
This segmentation is a combination of many criteria, that will take so much time if you do it manually with complicated SQL and codes, to suggest the most applicable segments for your customers, leading appropriate actions in marketing and sales strategy.
After clustering, you can use the segmentation dimension as any other dimensions in your workspace. It can be broken-down by related metrics:
{% hint style="info" %}
The temporary name of the clustering dimension is visible in the chart 
{% endhint %}
You can save the Clustering dimension by using the side bar:
Then, you can name, describe and save this Clustering dimension, and use it like any other dimensions.