# Creating Versions
### Create a Version in Table
You can create a planning/ forecasting version at Presight and choose view your versions at the **Forecast** session.
{% hint style="warning" %}
Make sure you turn on the **Forecast Mode** in your Table or Chart 
{% endhint %}
You can create your new version in a Table, at the forecast section, then choose **New Version**
Click on the Forecast
Choose New Version
You can name your version, choose the color and describe your version, then click on **Create Version**
{% hint style="info" %}
Coloring your versions can help to find your versions more easily, especially when you compare many versions together.
{% endhint %}
Then, you can input values in you version, in the metric and sub-metrics.
{% hint style="info" %}
You can input numbers in all time granularity **Daily, Monthly, Quarterly** and **Yearly**, and at **all dimension levels**. However, the numbers in each level will not be auto-reconciled.
The auto-reconciliation will be in the near future release.
{% endhint %}
Once you have done inputting, the version is automatically saved and ready to view.
### Create and view a Version in Chart
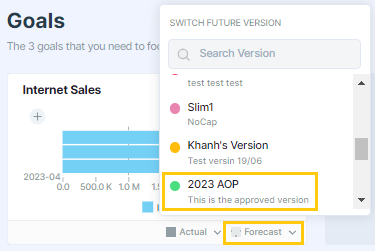
You can view the newly created version in Chart by choosing it from the list.
Choose to view a version
You can also edit or add the planning/forecasting numbers from the Chart by **`dragging and dropping`** the columns. The updated numbers will be adjusted accordingly in the table.
Drag and drop to edit versions
After keying in planning/forecasting numbers, the version will be automatically saved and ready to be viewed for everyone in the workspace.
### Compare actual vs a Version on Table
You can compare your new version with actual. By clicking on the data point you want to compare, you can find **`Compare Version`**:
Compare mode with a version
### Compare actual vs a Version on Chart
You can compare actual and a planning version in Chart to review performance by turning on the **`Compare icon`**  at the bottom of the Chart.
Compare Actual to AOP 2023
### Set your new Planning Version as new goals
You can set your Planning Version to be new goals in the Homepage.
### Set your new Planning Version as `Default`
You can set your Planning Version to the **Default Future Version** in your workspace. The chosen Version will be defaulted for everyone in the workspace.
---
# Agent Instructions: Querying This Documentation
If you need additional information that is not directly available in this page, you can query the documentation dynamically by asking a question.
Perform an HTTP GET request on the current page URL with the `ask` query parameter:
```
GET https://presight.gitbook.io/presight-v1.0/planning/creating-versions.md?ask=
```
The question should be specific, self-contained, and written in natural language.
The response will contain a direct answer to the question and relevant excerpts and sources from the documentation.
Use this mechanism when the answer is not explicitly present in the current page, you need clarification or additional context, or you want to retrieve related documentation sections.