> For the complete documentation index, see [llms.txt](https://presight.gitbook.io/release-notes/llms.txt). Markdown versions of documentation pages are available by appending `.md` to page URLs; this page is available as [Markdown](https://presight.gitbook.io/release-notes/release-202306.1.md).

# Release 202306.1

### 1. Creating a planning version

#### **1.1.** Create a planning version in Table

You can create a planning/ forecasting version and input your own numbers at Presight  and choose view your version at the <mark style="color:blue;">**Forecast**</mark> session.

<figure><img src="https://3252278699-files.gitbook.io/~/files/v0/b/gitbook-x-prod.appspot.com/o/spaces%2Fuw73QECHdzVpHJDEhaPB%2Fuploads%2F729wKOksr0lmqoA6hxDh%2Fplanning.gif?alt=media&amp;token=425fb87f-14a5-4ff6-8961-f1f561072372" alt=""><figcaption></figcaption></figure>

#### **1.2. Create and** View a Planning version in Chart

You can view the newly created version in Chart by choosing it from the list.

<figure><img src="https://3252278699-files.gitbook.io/~/files/v0/b/gitbook-x-prod.appspot.com/o/spaces%2Fuw73QECHdzVpHJDEhaPB%2Fuploads%2FWwuYLZvEOgUymttWRVO8%2Fimage.png?alt=media&amp;token=dc22c174-e1b2-4aaf-acad-123aba05c4bd" alt=""><figcaption></figcaption></figure>

You can also add or edit planning numbers in Chart by dragging and dropping:

<figure><img src="https://3252278699-files.gitbook.io/~/files/v0/b/gitbook-x-prod.appspot.com/o/spaces%2Fuw73QECHdzVpHJDEhaPB%2Fuploads%2Fdn06p0YHfM0ZGbAwLDMU%2Fimage.png?alt=media&amp;token=be36f36e-37fd-4f40-8e35-3719e7d97b4d" alt=""><figcaption></figcaption></figure>

#### **1.3.** Compare actual numbers with a version

You can compare your new version with actual. By clicking on the data point you want to compare, you can find **`Compare Version`**:&#x20;

<figure><img src="https://3252278699-files.gitbook.io/~/files/v0/b/gitbook-x-prod.appspot.com/o/spaces%2Fuw73QECHdzVpHJDEhaPB%2Fuploads%2Fx59Xm8d06bixa0gsQ2CL%2Fimage.png?alt=media&amp;token=a79d8512-3f98-4992-998c-af4281264810" alt=""><figcaption></figcaption></figure>

<figure><img src="https://3252278699-files.gitbook.io/~/files/v0/b/gitbook-x-prod.appspot.com/o/spaces%2Fuw73QECHdzVpHJDEhaPB%2Fuploads%2Frzdeng10sVmUH60v6V4z%2Fimage.png?alt=media&amp;token=2ab92610-f2ab-4b72-9c82-84e085ab2467" alt=""><figcaption></figcaption></figure>

#### 1.4. Add your Planning Version as new goals

You can set your Planning Version to be new goals in the Homepage.

<figure><img src="https://3252278699-files.gitbook.io/~/files/v0/b/gitbook-x-prod.appspot.com/o/spaces%2Fuw73QECHdzVpHJDEhaPB%2Fuploads%2FIqfBxQL766xTBKoEbXTx%2Fimage.png?alt=media&amp;token=449e9ab1-1348-4c0f-8f68-57829be18ad1" alt=""><figcaption></figcaption></figure>

{% hint style="info" %}
**Full instruction** [<mark style="color:orange;">**Here**</mark>](https://presight.gitbook.io/presight-v1.0/planning/creating-versions)**!**
{% endhint %}

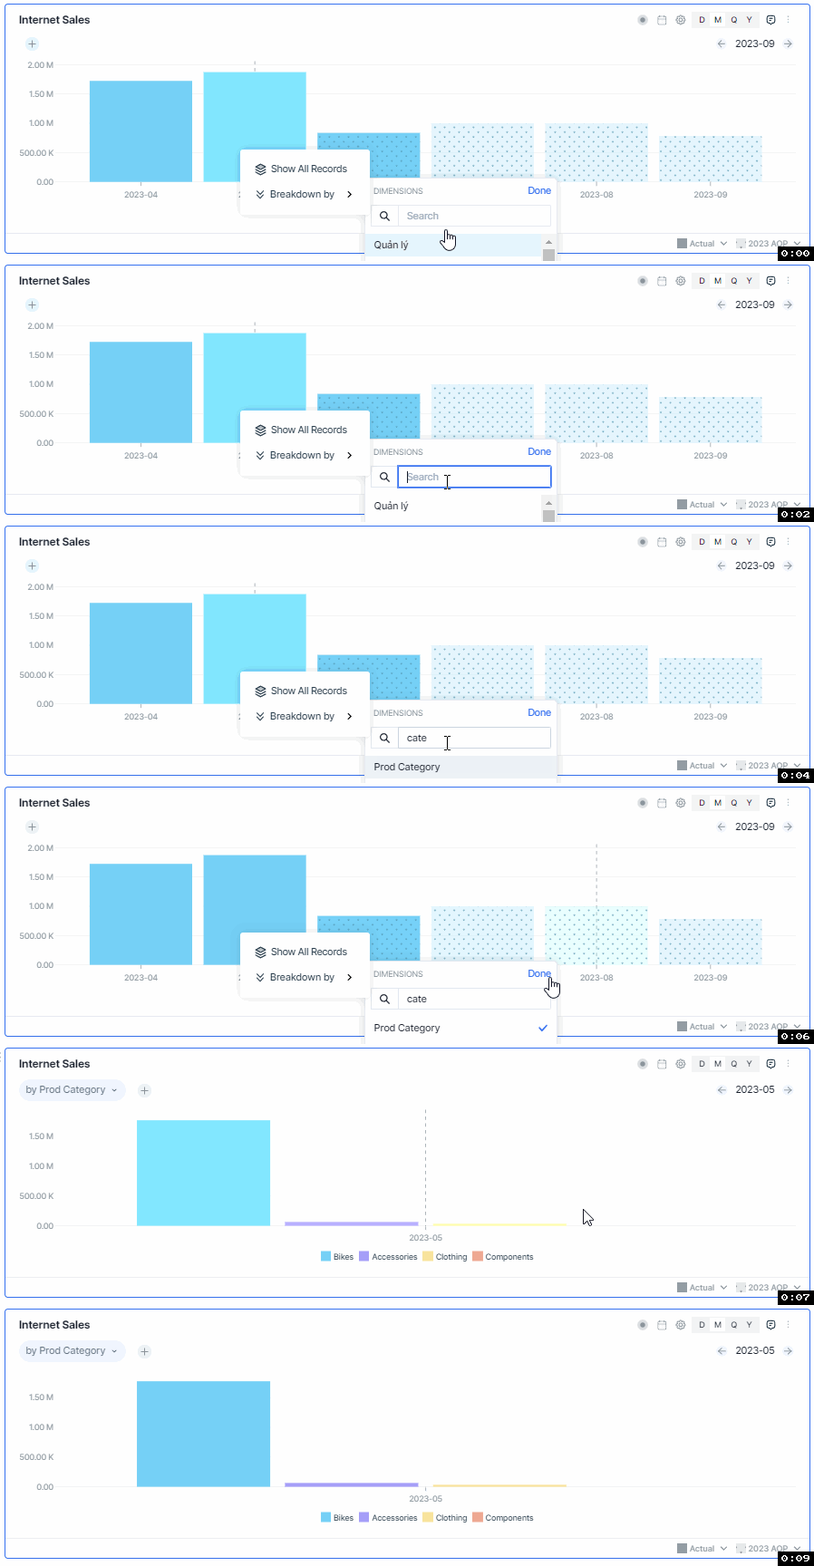
### 2. Right-click breakdown on any data point on Chart

You can breakdown at any data point to deep-dive to the metric by right-clicking on the data point and choose **`Breakdown by`**&#x20;

<figure><img src="https://3252278699-files.gitbook.io/~/files/v0/b/gitbook-x-prod.appspot.com/o/spaces%2Fuw73QECHdzVpHJDEhaPB%2Fuploads%2F11GBKKppN3KA4bngg9DD%2Fbreakdown.gif?alt=media&amp;token=36eaa084-987e-4436-a350-ecfe2c2f9c8c" alt=""><figcaption></figcaption></figure>

{% hint style="info" %}
**Full instruction** [<mark style="color:orange;">**Here**</mark>](https://presight.gitbook.io/presight-v1.0/analysis/data-widgets/charts/interacting-with-a-chart/breakdown)**!**
{% endhint %}